This infographic was created to visually explore the complex intersection between urban parking systems and vehicle residency in Seattle. It aims to present data and lived realities in a way that informs conversation—acknowledging the challenges faced by both residents seeking shelter and the City’s need to manage public space fairly and effectively.
The design uses visual storytelling to bring clarity to a multifaceted issue, encouraging shared understanding and dialogue. By highlighting patterns and pressure points, this work supports collaborative exploration of solutions that balance equity, public safety, and practical infrastructure management.
This piece was intended for use in city council briefings, nonprofit advocacy meetings, and public-facing education materials—places where design can function not just as decoration, but as intervention.
Project Goals:
+ Translate complex civic data into accessible, human-centered visuals
+ Present both resident experience and city policy without assigning blame
+ Provide a tool for council briefings, public education, and advocacy dialogue
+ Highlight systemic pressure points that prevent sustainable parking or housing solutions
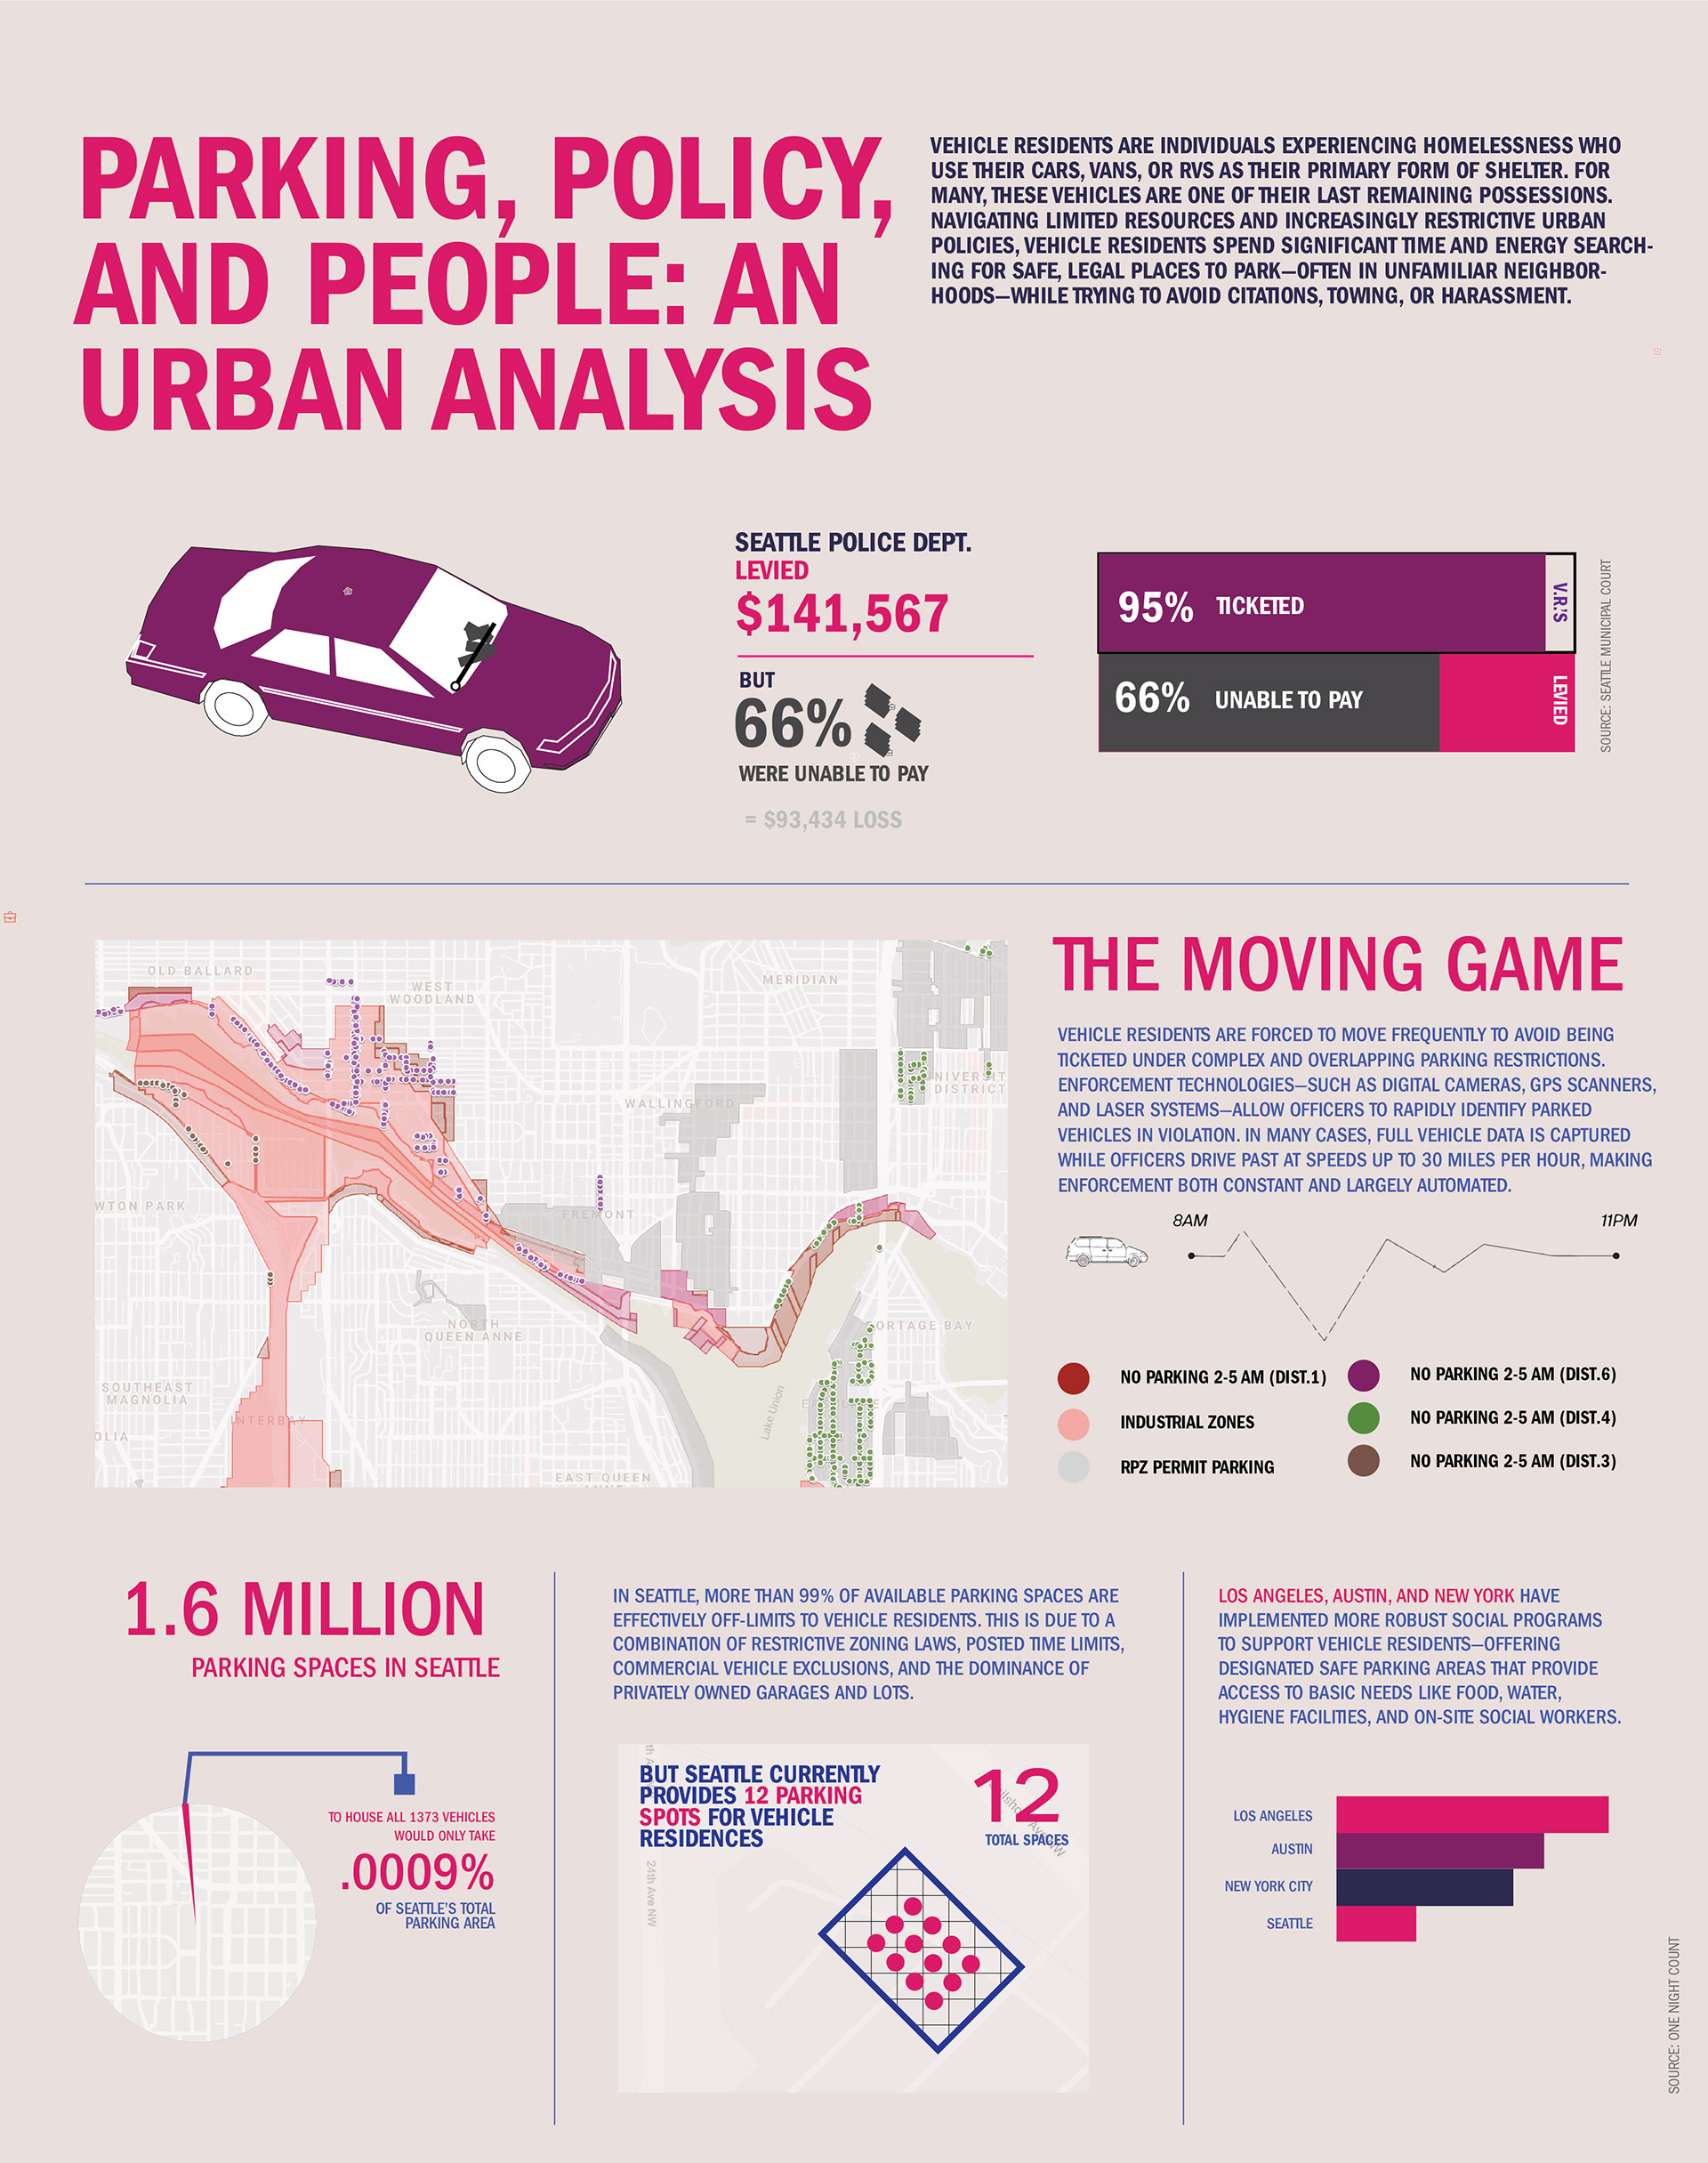
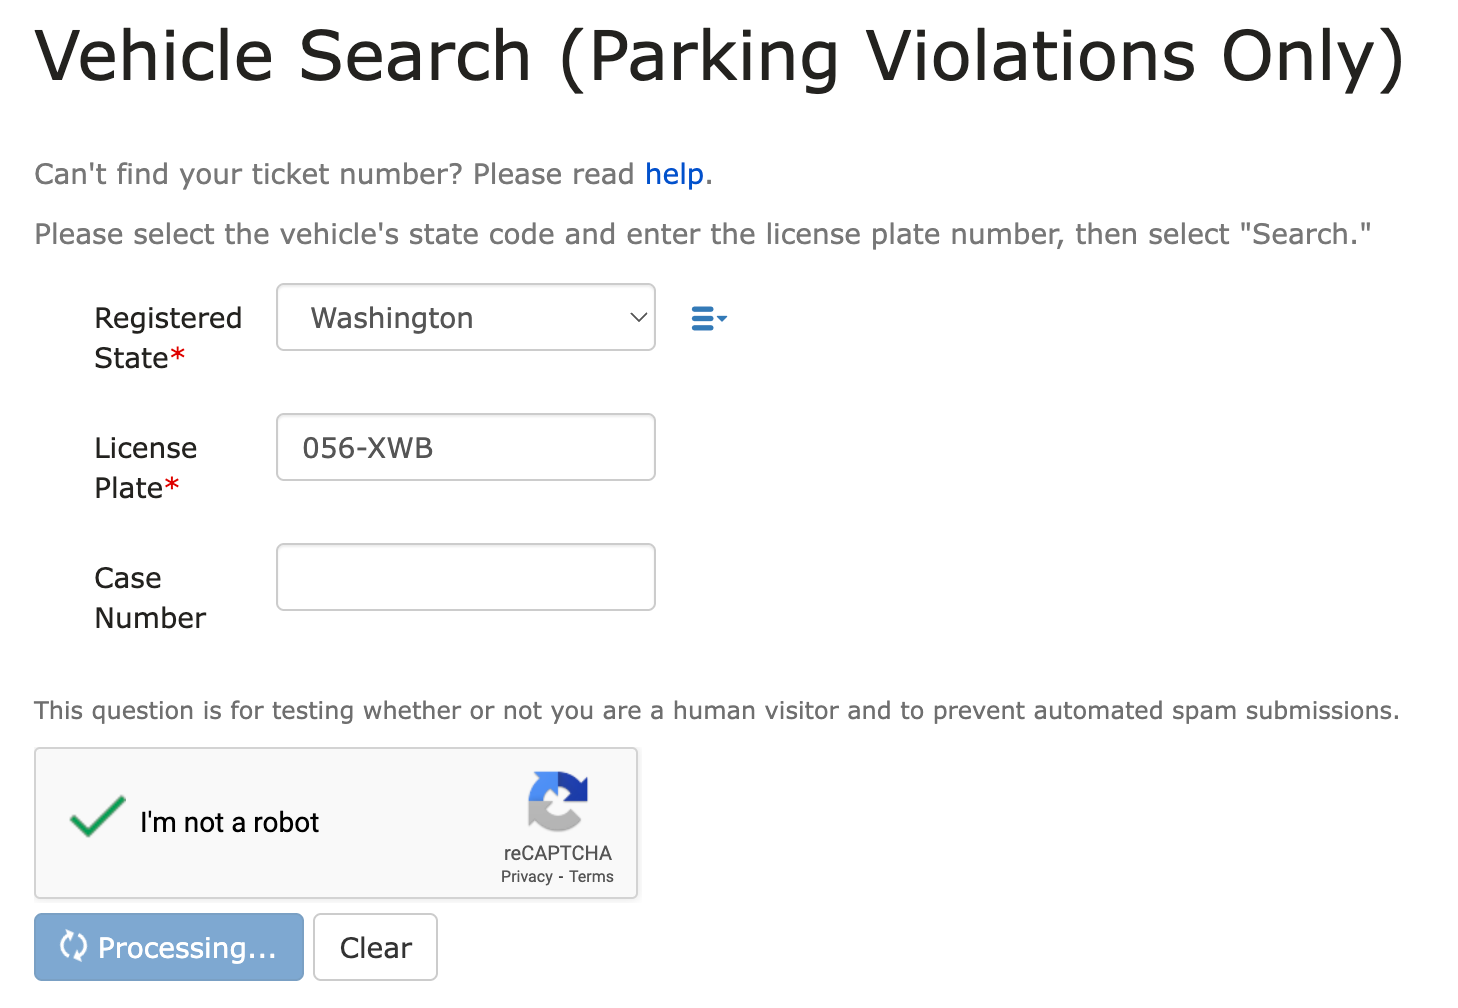
This project leveraged data provided by the Seattle Municipal Court’s records on parking infractions. Our team compiled a dataset by cross-referencing license plate numbers from over 1,000 vehicles identified as likely vehicle residences. Citation data—including location, violation type, and frequency—was extracted and organized in a structured spreadsheet to identify enforcement patterns across time and geography.
This dataset served as the backbone of the infographic, informing both the narrative flow and spatial mapping. The approach emphasized transparency and repeatability, aligning with open data principles and ethical design standards in civic information work.
Tools: Illustrator, GIS reference maps, data spreadsheets